• Mode-1 Multi-Core • Memory Allocators • OpenMP • Intel TBB • Pthreads • Java - Threads • Charm++ Prog. • Message Passing (MPI) • MPI - OpenMP • MPI - Intel TBB • MPI - Pthreads • Compiler Opt. Features • Threads-Perf. Math.Lib. • Threads-Prof. & Tools • Threads-I/O Perf. • PGAS : UPC / CAF / GA • Power-Perf. • Home


hyPACK-2013 Mode 1 : Intel Performance Tools

A brief summary of selective Intel Multi Core Programming Enviornment tool suite is discussed in various parts of PEMG-2010 web-page. Important Tools such as the Intel VTune Performance Analyzer which can be used to monitor porcessors events realted to multi-threaded performanace, the Intel Thread Checker, the Intel Thread Debugger and the the Intel Thread Profiler have been used in PEMG-2009 and subsequent artiles brifely discuss the Intel Software tool Suite.

Introduction     Intel Thread Checker     Intel Thread Profiler       VTune Analyzer

How to use Thread Checker       How to use VTune Analyzer

Example Programs        

List of Pthreads Programs

Example 1.1


Write a Pthread program to find out number of primes number with in range 1 to 20000 using shared variable. Using Intel Thread Checker, Find out Whether any Data Race Condition appears during execution.

Example 1.2

Take Correct Version of Example 1.1. Use Intel VTune Performance Analyzer to analyze this application to reduce execution time. (. Assignment )

Example 1.3


Write a Pthread program to compute Matrix Matrix Multiplication. Use Intel Thread Checker with this application to find out any possible existence of deadlock , data race situation.

Example 1.4


Use Example 1.3 with Intel Vtune Performance Analyzer to find out most time consuming section of this application. Take appropriate corrective measure and develop new version of optimized application. (. Assignment )

Introduction


For extracting maximum efficiency from multicore, we need to execute tasks in parallel. No use of adding that extra core if it sits idle while the first core is executing your neat serial program. To execute in parallel means that you have to split up the computations into separate threads that run concurrently. However it seems difficult to organize multiple work at single time. As a result application meant for multicore system, become difficult to design and error prone. The lack of parallel-programming tools and expertise among designers may threaten the progress of multi-core architectures. Fortunately, there are parallel programming tools, which allow application desingers to design and debug parallel application more effectively.

How to use Thread Checker

  • step 1: from command line do the following

    $ source /opt/intel/itt/tcheck/bin/32/tcheckvars.sh

  • step 2: Go to the directory, where your executable resides.

  • step 3: Use following command

    $ tcheck_cl ./ <your-executable-name>

  • step 4: wait till thread checker complete it execution and display human readable diagnostic of your executable.

Intel Thread Checker


Intel® Thread Checker detects data races, deadlocks, stalls, and other threading issues. It can detect the potential for these errors even if the error does not occur during an analysis session. Use Thread Checker to filter out specific types of diagnostics, identify critical source locations, and get tips to improve the robustness of your parallel software.


Output :


Figure 1. Intel Thread Checker


Intel Thread Profiler


Intel® Thread Profiler helps you improve the performance of applications threaded with Windows* API, OpenMP* , or POSIX* threads (Pthreads*). Use Thread Profiler to:
    - Identify bottlenecks that limit the parallel performance of your multi-threaded application.
    - Locate synchronization delays, stalled threads, excessive blocking time, and ineffective utilization of processors.
    - Find the best sections of code to optimize for sequential performance and for threaded performance.
    - Compare scalability across different numbers of processors or using different threading methods.


Output :


Figure 1. Intel Thread Profiler


Intel VTune Performance Analyzer


The VTuneT Performance Analyzer provides information on the performance of your code. The VTune analyzer shows you the performance issues, enabling you to focus your tuning effort and get the best performance boost in the least amount of time.
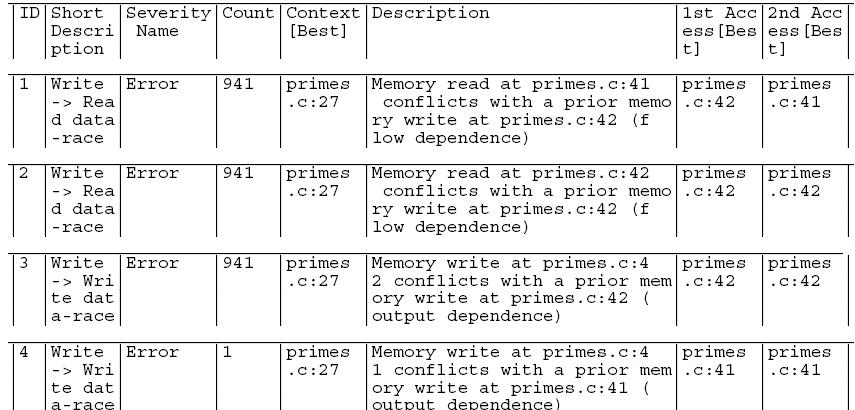

Output :


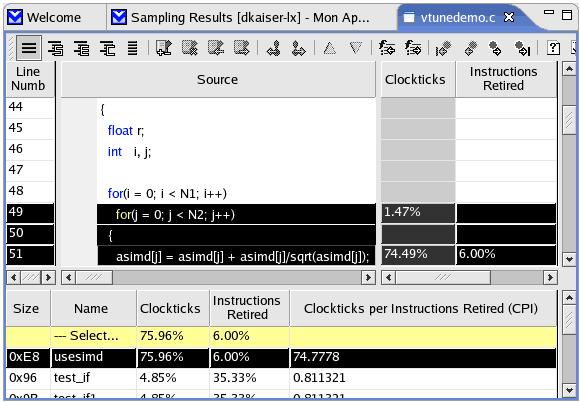
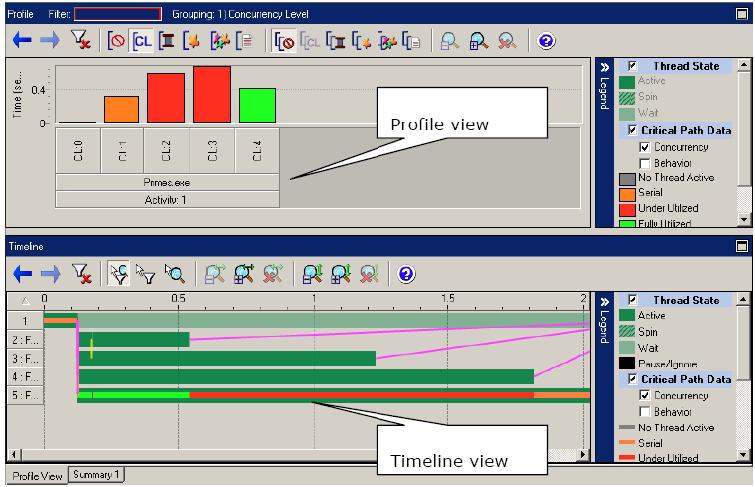
Figure 2. Intel VTune performance analzer


How to use VTune

  • step 1: from your source code directory type following command.

    $ source /opt/intel/vtune/bin/vtunevars.sh

  • step 2: Use following command to open VTune GUI

            $ vtlec


Centre for Development of Advanced Computing